
With the Statistics function, you can extract statistics on work you have done, consumption of articles and time spent on a customer, a facility, etc. The results from your searches in the statistics can be downloaded in a csv file so that you can, for example, process the data further or use in a presentation.
The possibilities are many and there is always the possibility of producing statistics – even retroactively.
Contact us if you want to active the function Statistics.
You can sort the information you get by clicking on the headings in the list.
Here, the various parts found in statistics today are described.
First, choose what type of data you want:
- Work order
- Serviceprotocol
- Articles
- Tid
- Sales order
- Quotation
- Sales order article

You can filter on:
- Time interval
- Customer
- Facility
To be able to select facility choose customer first. - Service object
If you have chosen a customer the customers service objects will be listed. - Model
- Category – see more in the next paragraph.
- Type of order
- Assigned to (user)
- Added by (only displayed if you have selected articles under TYPE)
- SHOW ONLY gives you the option to filter on a variety of statuses such as Ready for invoicing, signed, assigned, etc.
- Date interval.
Day is from 00:00:01 to 23:59:59.
Depending on what you use, the following is also displayed:
- Subgroups
- Custom status
- Tags
- Order type
- Certificate
Category
Category is used, for example, to retrieve information about a certain type of model from one or more customers. To identify such, you put these service objects together in a category. Click +Add Category.
This function can be used, for example, to see if you have models that often have the same kind of problem.
TYPE
When you have chosen a type, you can produce different statistics.
Work order
Here are a number of additional filters to set up to get the exact statistics you need.
- Show canceled
- Show signed
- Show invoiced
- Show number of measures
- Show ordered parts
- Show response time
- Show completion time
The result is displayed in a table, in a compilation and a csv file to download for further processing. Tip how to convert a csv file to xlms fcan be found here.
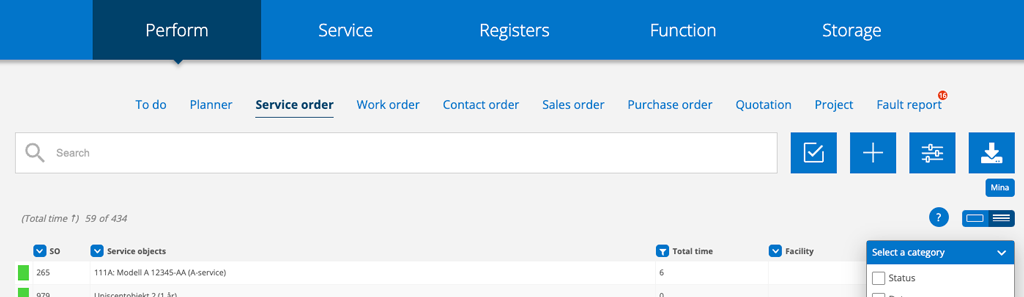
Select sorting by clicking on the headings. An arrow shows which sorting is being done (see Image 3)
If you want to review an individual order, click on the order number in the list.
Service protocol
Lists all service protocols with information about when the protocol was created and executed, whether it was signed and sent to the accounting program, and the gross and net value of the articles. Total time is the sum of all time articles. on the service protocol.
Below the list of service protocols is a summary of the service points from the protocols.
Do you only want to see time on the Service Order? Choose to display the Total Time category in the Service Order list view. Click the + sign to the right above the list and select Total time.
Articles
All articles summed up from all orders with information on number, gross and net during a selected time period are listed. Summary appears at the bottom below the articles. There is also a button to download the list as csv file.
A column will also open where you can choose to filter by user – SHOW ADDED BY.
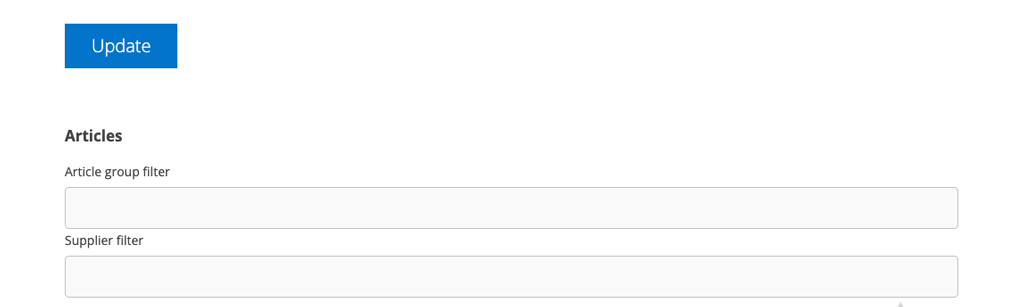
If you want to filter the search on an article group or supplier, fill in the information and click Update.
If you want to change the sorting, click on the headings (ARTICLE NUMBER, DESCRIPTION, QUANTITY …). An arrow shows which sort you have selected. In the example below, the list is sorted by description in alphabetical order from A (numbers first) to Z.
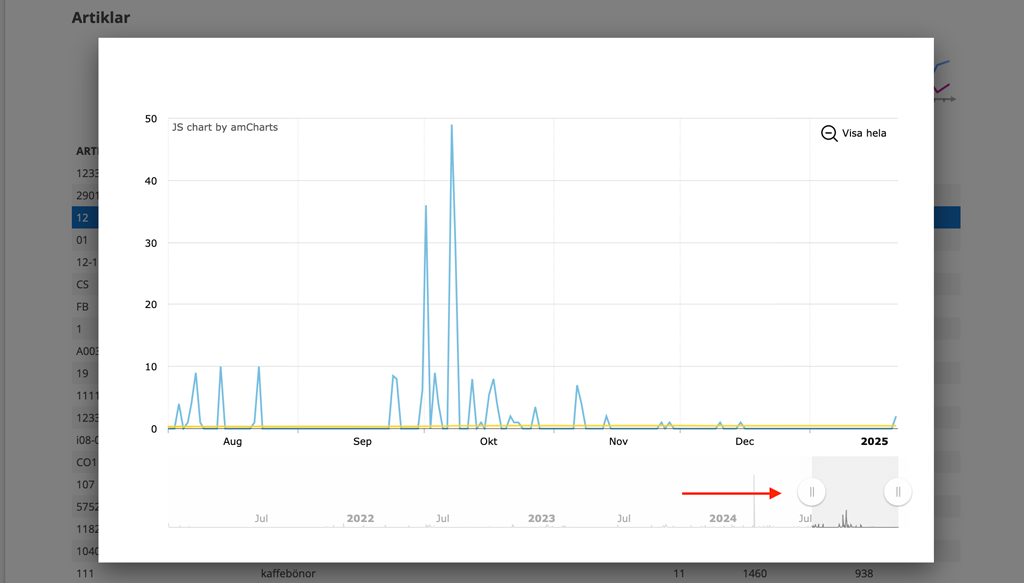
To get more information about when an article has been used do this:
- Select an article so that the line turns blue.
- Then click on the symbol for the graph tool (marked with a red box in the image below)

This is what a graph looks like.
Time
Here you can take out time per user including external resources, see time worked, holidays etc. The time is shown in a diagram and in numbers. You can select multiple users.
Select which users you want to extract statistics for.
If you make changes to the selection, update by clicking the Update button above the list of users.
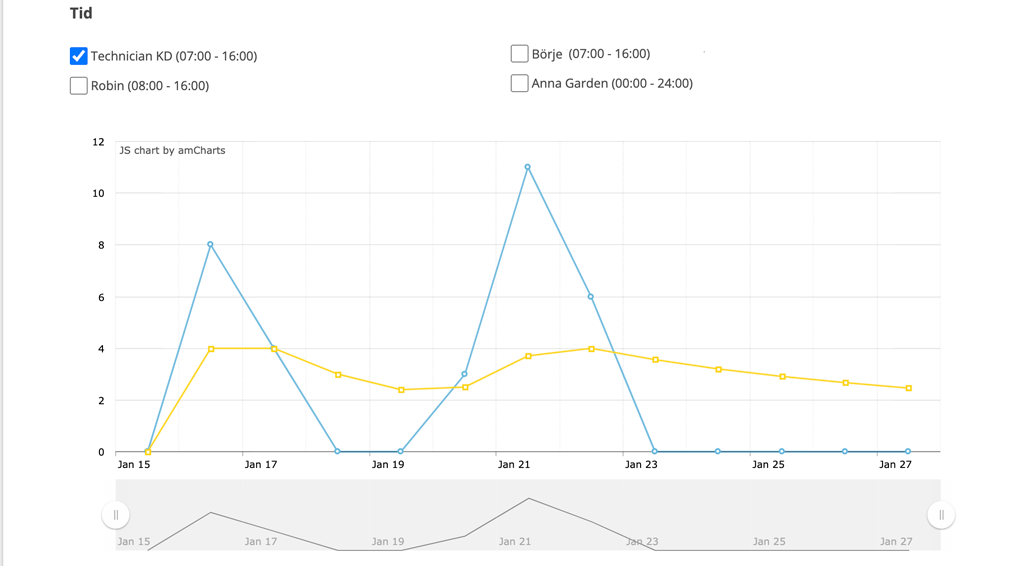
The blue line shows the number of hours per day.
The yellow shows the average number of hours per day.
Below the graph you see a compilation and summation of time for the user(s). The date for this particular search on “Technician KD” was Jan 15 – Jan 27 = 9 working days and 4 Sat/Sun which gives 13 days.
The technician has worked on a Saturday.
Entered working time in user settings is 8 hours/day.
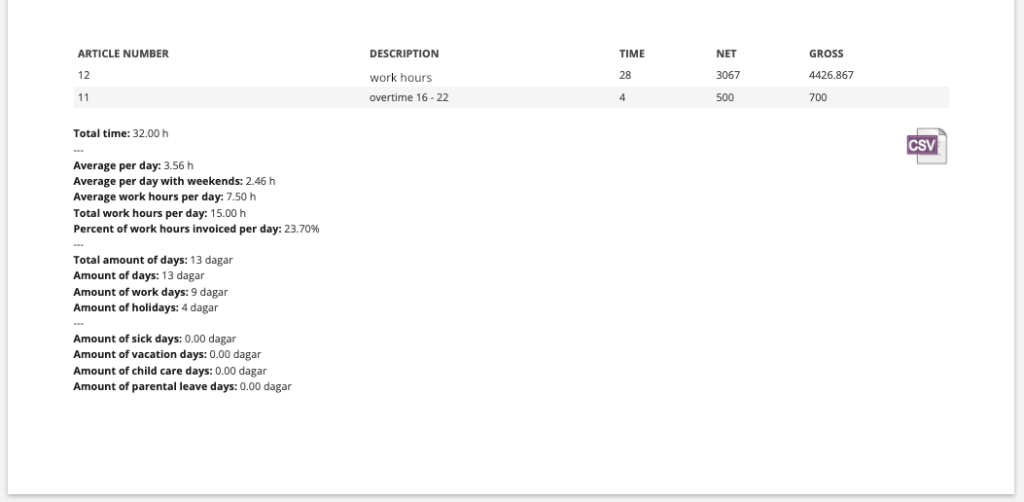
The compilation can be downloaded as a csv file. Click on the csv symbol on the right side of the page.
Sales order
Here you get a list of the value of ordered articles (gross and net) as well as information about whether a confirmation has been sent and whether the order has been invoiced.
Below the list of sales orders, a summary is displayed – Total gross sum of all ordered articles.
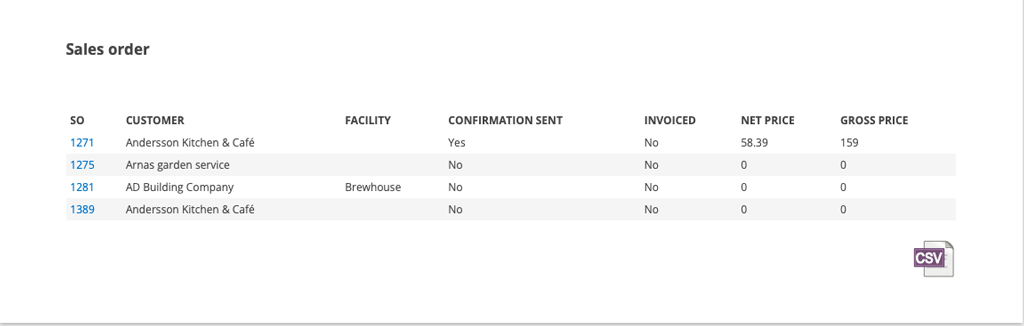
The compilation can be downloaded as a csv file. Click on the csv symbol on the right side of the page.
Quotation
Gives a list of quotations with this information:
- quotation number
- customer
- if an order is generated yes/no and date of this
- date when the quote was created.
Sales order article
Provides statistics for deliveries per item on sales orders.
How it works:
- The statistics show one row per delivery (not just totals)
- Every time the delivered quantity changes, a new row is created in the statistics.
- Delivery date is based on when the change was made in the system
- Both increases and decreases in delivered quantities are shown (e.g. corrections)
Information displayed per line:
- Order number
- Customer
- Customer number
- Sales person
- Article number and description
- Ordered amount
- Quantity delivered (for that particular event)
- Unit
- Nettopris
- Integration reference
- Delivery
- Net amount for the line
Other:
- Also included are articles linked via service objects.
- Totals are based on all delivery events, not just the current value
- Provides a more accurate and detailed picture of what has actually been delivered over time
Good to know:
This feature is not backward compatible. Older data will lack history because the system previously did not save enough information to recreate each individual delivery linked to an article line. This counts based on changes made to the order and not via the storage, so it works even if you do not use storage, have storage “Not selected”, etc.